The AI AdoptionFree AI pre-audit
Where the figures come from
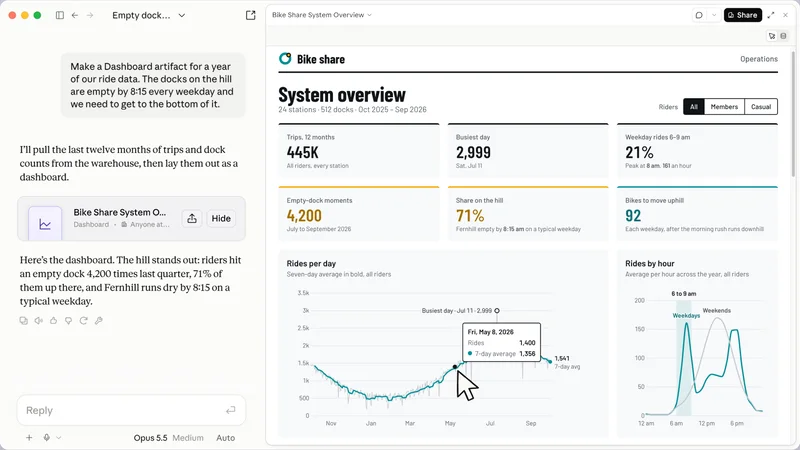
Every AI dashboard reads its figures from somewhere. In Claude Data, that is a data warehouse your company connects, such as BigQuery or Snowflake, or another app already connected to Claude, such as Salesforce. In Power BI, Copilot answers from the semantic model behind the report, which is the prepared version of your data that the report is built on.
Microsoft says what happens when that model is not ready. When a question is about the data in the model, Copilot uses the model. Otherwise it answers from the general knowledge of the AI model, and without preparation it can misread the data.
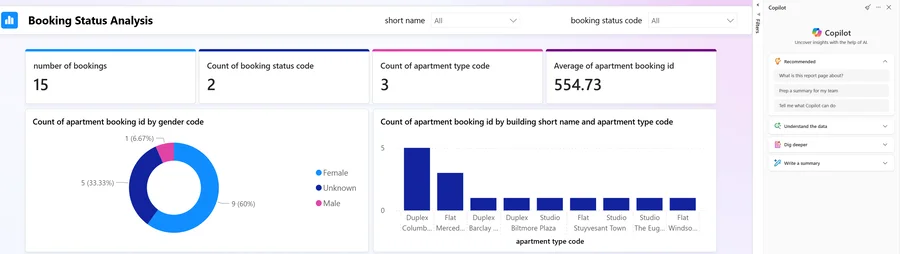
Without preparation, Copilot can misinterpret the data and return generic or inaccurate results.
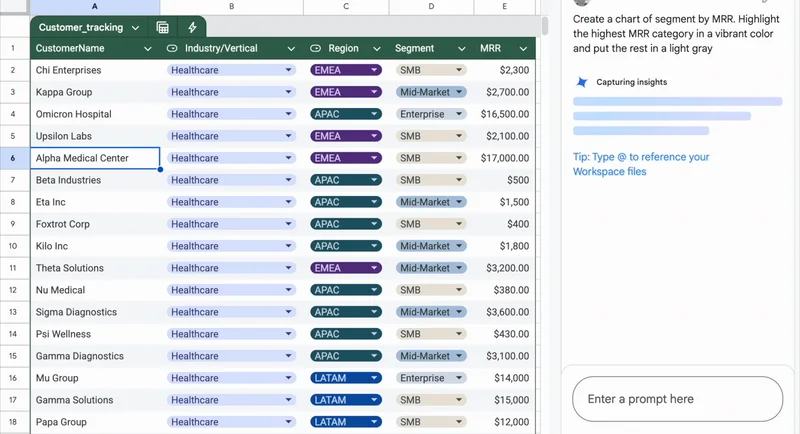
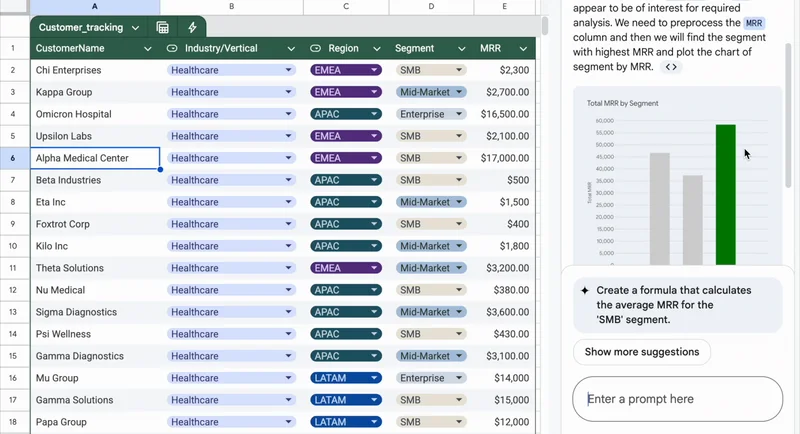
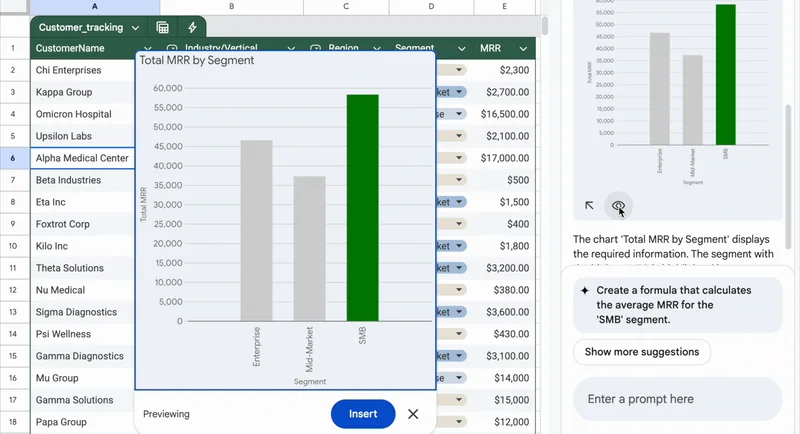
The same goes for a chart made from a table pasted into a chat, or typed into a sheet by hand. Google says a chart that Gemini generates in Google Sheets does not change when the original data changes. Only a chart built from a BigQuery Connected Sheet stays linked and updates when you refresh it.
In most businesses the figures already live in a few places: the accounting software, the point of sale, the stock system, the CRM. A dashboard you can rely on reads those systems directly. The figure on screen is then the one in your accounts, and nobody copies numbers from one place to another before the weekly meeting.